Many cities across the country are questioning how far we’ve really come to make bicycling a substantive mode of transportation.
Spinning Our Wheels: Bolstering Bicycling in the U.S.
Spinning Our Wheels: Bolstering Bicycling in the U.S.
The automobile may have annihilated time and space on the interstate…but in a car-choked city, it is once again the bike that magically shrinks the distance between here and there, allowing riders to percolate through the gridlock while drivers sit and fume.
– Margaret Guroff
As cities across the country celebrate National Bike Month, many are questioning how far we’ve really come to make bicycling a substantive mode of transportation. Are bikes in a boom or bust cycle?
The League of American Bicyclists has sponsored May is National Bike Month since 1956 as a way to showcase the benefits of bicycling and encourage more people of all ages to ride a bike.
Despite all the increased activity around Bike Month, the launch of bike-share programs in more than 60 cities across the country and thousands of bike lanes popping up in cities big and small, urban studies theorist Richard Florida says this apparent bike boom is in part an optical illusion.
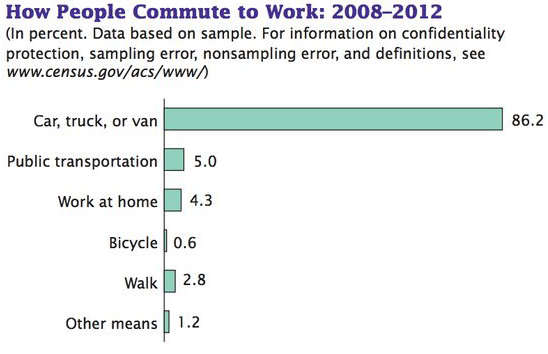
The number of regular bike commuters has increased by more than 60% between 2000 and 2013 but that number remains a relatively small portion of total commuters, except in a handful of college towns and West Coast cities. Nationally, fewer than 1 in 100 commuters (0.6%) bike to work at least once a week. By comparison, 86% of commuters drive their cars to work.
It may be fair to say that Americans are getting off their bikes: Ridership has dropped since 2000, and bicycle sales are also down. Most troublingly for livable-community advocates is the sharp decline among children – from more than 11 million bikes sold in 2000 to less than 5 million in 2013.
While workers in big cities are more likely to bike to work than those in other areas, the reality is that just 1% of Americans who live in one of the 50 largest cities in the U.S. cycle to work. Even in bike meccas like Portland, the platinum awarded “bicycle friendly community,” only 2% of commuters bike.
| Rank | Metro Area | Share of bike commuters |
|---|---|---|
| 1 | Portland-Vancouver-Hillsboro, OR-WA | 2.35% |
| 2 | San Francisco-Oakland-Hayward, CA | 1.97% |
| 3 | San Jose-Sunnyvale-Santa Clara, CA | 1.85% |
| 4 | Sacramento-Roseville-Arden-Arcade, CA | 1.83% |
| 5 | New Orleans-Metairie, LA | 1.16% |
| 6 | Seattle-Tacoma-Bellevue, WA | 1.12% |
| 7 | Minneapolis-St. Paul-Bloomington, MN-WI | 0.96% |
| 8 | Boston-Cambridge-Newton, MA-NH | 0.91% |
| 9 | Los Angeles-Long Beach-Anaheim, CA | 0.91% |
| 10 | Denver-Aurora-Lakewood, CO | 0.88% |
Low Hanging-Fruit: Making the Short Trip by Bike
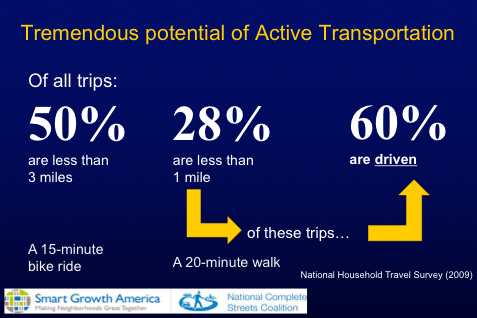
Converting short trips from cars to bikes could result in tremendous health and economic benefits for individuals – and reduced air pollution and traffic congestion for the community as a whole. According to a National Household Travel survey, 50% of all trips are less than three miles (a 15-minute bike ride) and 28% are less than one mile (a five-minute bike ride or 20-minute walk) yet 3 in 5 short trips (60%) are made by car.
In California, there is an even higher percentage of short trips that are less than one mile (34%), but roughly still the same percentage (58%) are reported as vehicle trips.
If we could just shift the people driving for trips less than one mile we would eliminate about 20% of car trips in California.
Riding a Bike is Good for Business
People who walk and bicycle to shop spend more money than people who drive. Studies conducted in New York, Toronto, San Francisco and Portland found that retail activity goes up after bike lanes are added and traffic is calmed.
Why is that? People stop to shop, or grab a bite to eat, more often when bicycling or walking down a street than they do driving their car down the same street. The drivers who do stop may spend more in one single trip by driving, but people bicycling and walking make more trips and spend more money overall.
Research from a number of studies indicates more people on bikes means more customers in stores. Highlights from a few of them:
A survey of 89 businesses showed people walking and bicycling spend up to 50% more per month than drivers. In New York, after installing protected bikeways on 8th and 9th avenues in Manhattan, retail activity increased 49% compared to a 3% increase borough-wide over the same period.
In Oakland, 2016 retail sales data demonstrated a 9% increase in sales after a road diet with protected bike lanes was implemented in the northern segment of Telegraph Avenue. This year-over-year sales increase was greater than that of other business districts in Oakland during the same period.
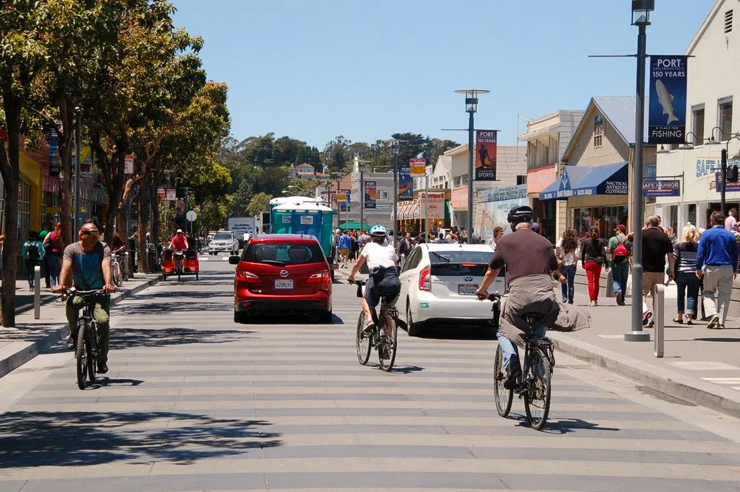
On the other side of the Bay, San Francisco gave Fisherman’s Wharf a people-friendly redesign on two blocks of Jefferson Street. Business is booming two years later, despite merchants’ fears that removing all vehicle parking would hurt their sales, they now say it had the opposite effect.
Bicycling Produces Health Benefits and Cuts Healthcare Costs
Caltrans recently adopted California’s first statewide bicycle and pedestrian plan, Toward an Active California, which serves as a roadmap to achieve the State’s ambitious goals to double walking and triple bicycling trips by 2020, and reduce bicycle and pedestrian fatalities by ten percent each year. Doing so would lead to 2,095 fewer deaths and 30,124 fewer years of life lost and disability at an annual value of $1 billion to $15.5 billion prevented premature deaths and disability.
If Californians increases active transport to just 21.4 minutes per day – California could experience 8,057 fewer annual deaths and 142,101 fewer years of life lost and disability at an annual savings of $5.7 to $59.6 billion. Assuming half the increases in active transport are offset by less car travel, annual car carbon emissions would decline between 3% to 14%.
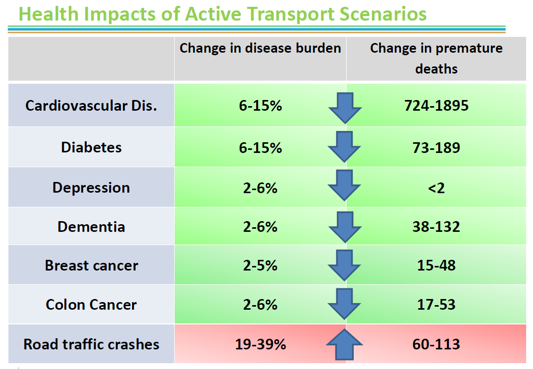
In the Bay Area, increasing the average person’s weekly walking and bicycling time from 31 to 154 minutes was modeled to result in 13% fewer premature deaths and 15% fewer years of life lost from cardiovascular disease and diabetes as well as 5% reductions in four other chronic diseases (depression, dementia, breast cancer and colon cancer) according to epidemiologist Neil Maizlish.
After accounting for a 19% increase in the disease burden from fatal and serious traffic injuries to pedestrians and bicyclists from increased exposure, the Bay Area would still experience 2,236 fewer deaths and 22,807 years of life gained.
Reducing risks from chronic disease by this magnitude would rank among the most notable public health achievements in the modern era. It would also reduce California’s estimated $34 billion annual cost from cardiovascular disease and other chronic conditions (such as obesity) and achieve the U.S. Surgeon General’s recommended 150 minutes of moderate physical activity weekly.
Given compounding challenges – such as obesity-related health problems, climate change impacts, air pollution, the economic decline of commercial corridors, aging infrastructure and roadway congestion – relatively low-cost investments in bicycling programs and infrastructure could have a big payoff.
Steve Towsen, Portland’s city engineer, attributes the bicycling boom to investment in bicycle infrastructure, saying, “Bicycling infrastructure is relatively easy to implement and low-cost compared to other modes.”
Portland estimated the cost of its 300-mile network of bike trails, lanes, and boulevards at approximately $60 million in 2008, which is about the same cost as one mile of a four-lane urban freeway.
Bike-Friendly Strategies
There are a number of strategies local governments can pursue to increase bicycling and reap environmental, health and economic benefits.
Invest in bike infrastructure: Studies show that local bicycling infrastructure is strongly associated with overall levels of bicycling, especially with bicycling to work, school or shopping.
- One study of 35 large U.S. cities found that each additional mile of bike lane per square mile was associated with about a 1% increase in the share of workers commuting by bicycle (Dill, J., Carr, T., 2003).
- A more recent study using data from 90 large U.S. cities found that cities with 10% more bike lanes or paths had about 2% to 3% more daily bicycle commuters (Buehler R, Pucher J., 2012).
- A Seattle study found that adults living within a half-mile of a bike path were 20% more likely to bicycle at least once a week (Vernez-Moudon, A.V., Lee, C., Cheadle, A.D., et al., 2005).
Adopt supportive land-use policies: To increase the attractiveness of bicycling as a transportation mode, communities can also implement land-use and development policies to help ensure that daily destinations such as school, work and shopping are within convenient bicycling distance from home. The share of commuters who cycle to work is positively and significantly associated with higher density, more transit use and less sprawl.
Redesign streets with bikes in mind: Effective strategies to make our shared streets more bike- and pedestrian-friendly include retrofitting poorly designed roads by adding and widening sidewalks, roundabouts, curb ramps, better street lighting and more bicycle lanes (ideally protected lanes); narrowing streets; and installing crosswalks and better bus stops to make walking and biking safer and more convenient. Street redesigns can help lower speeds and reduce points of conflict between motorists and between cars, pedestrians and bicyclists.
Reduce car speeds: Speed intensifies the severity of a crash. Pedestrians and bicyclists are much more likely to survive being hit by a car going 20 mph (90%) than 40 mph (10%). Lower speed limits for vehicles make riding a bike safer and more appealing. One study conducted in Germany found that reducing general speed limits led to a significant increase in bicycling (Robinson, D.L., 2006).
Establish bicycle programs: Programs that promote bicycling may help increase the effectiveness of investments in bicycle facilities. Studies have reported long-term increases in bicycling following bike-to-work days, Safe Routes to School programs, “ciclovias” and similar events that close streets to cars for the enjoyment of bicyclists and pedestrians.
Invest in bike-sharing: Cities that have implemented bike-sharing programs report substantial increases in bicycling. For example, the proportion of trips made by bicycle increased from 1% to 2.5% in Paris, and from 0.75% to 1.76% in Barcelona.
Make bicycling more attractive to women: U.S. cycling has persistently suffered from a clear gender divide – with men almost three times more likely to ride their bikes to work than women (0.8% of men vs. 0.3% of women).
Investments in bike infrastructure should take into account gender differences. Several studies have found that women prefer bike lanes on streets that have fewer cars and/or are separated from traffic.
One study also found that women felt less comfortable than men on off-street paths, perhaps because of higher concerns about their personal security, such as fear of assault in isolated areas (Emond, C.R., Tang, W., Handy, S.L., 2009).
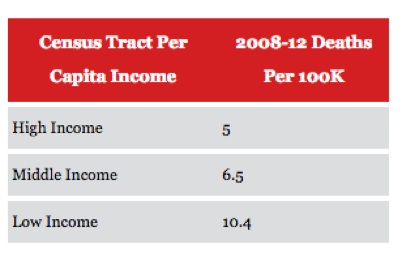
Invest in disadvantaged communities first: A recent “Governing” review of pedestrian deaths from 2008 to 2012 revealed that the fatality rate is twice as high in America’s poorest neighborhoods as in higher-income neighborhoods. Factors that influence the high, disproportionate fatality rate also affect bicyclists — including the higher rate of people walking and bicycling, higher likelihood of living near highways and major arterial roadways, and less pedestrian and bicycle-friendly infrastructure.
In high-income areas, 89% of streets had sidewalks, while only 49% did in low-income areas, according to field research funded by the Robert Wood Johnson Foundation. Marked crosswalks were found in 13% of high-income areas, compared to just 7% of streets in low-income communities. The study found similar disparities for street lighting and traffic-calming devices.
While recently bicycling has been targeted as a sign of neighborhood gentrification, a recent analysis by Charlotta Mellander, an economics professor at Jönköping International Business School, shows that there is little evidence bike commuting is associated with urban inequality or economic segregation. Bike commuting is not statistically associated with income inequality or income segregation, and it’s negatively associated with the segregation of the rich.
In fact, bicycling is one of the rare activities in modern society that may actually bridge some of our divides. The two groups most likely to bike to work are the most and least educated: 0.9% of adults with a graduate or professional degree and 0.7% of adults who did not complete high school.
A similar pattern holds true for income. Commuters at the lower end of the income spectrum are the group most likely to use bikes to get to work – bicyclists who live in households making $10,000 or less comprise a 1.5% share of commuters. That percentage falls as income increases with one exception— commuters with incomes over $150,000 bike to work at a greater proportion than their middle-income counterparts. Of course, wealthier individuals ride bicycles by choice – and have the means to live close to where they work. The economically less-fortunate more often ride their bikes out of necessity, underscoring the need to focus transportation-infrastructure investments in lower-income neighborhoods.
The Path to Better Biking
In her cultural history of the bicycle, The Mechanical Horse, Margaret Guroff writes, “The automobile may have annihilated time and space on the interstate…but in a car-choked city, it is once again the bike that magically shrinks the distance between here and there, allowing riders to percolate through the gridlock while drivers sit and fume.”
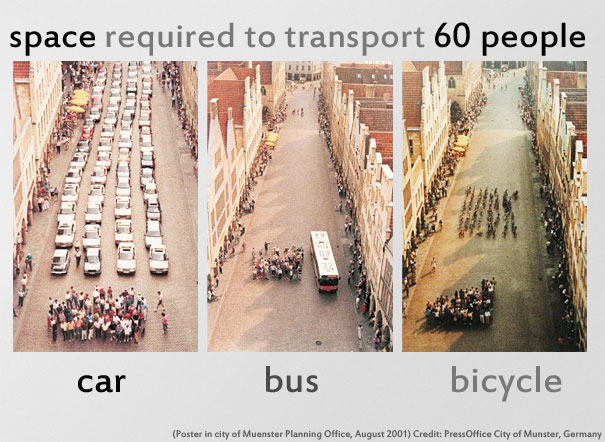
Bicycling offers a myriad of personal and community benefits, and delivers them at a lower investment cost compared to other transportation options. Knowing that, it seems almost irresponsible for local governments and businesses not to make better use of our streets and our limited transportation funds. Together, we turn the wheel to make sure that all of our communities can experience a real and lasting bike boom.
Resources
- Active Living Research, “How to Increase Bicycling for Daily Travel”
- Richard Florida article, “Mapping America’s Bike Commuters” May 19, 2017
- Active Transportation Program funds Infrastructure Projects and Educational Programs
- California’s t statewide bicycle and pedestrian plan, Toward an Active California
Local Government Commission Newsletters
Livable Places Update
CURRENTS Newsletter
CivicSpark™ Newsletter
LGC Newsletters
Keep up to date with LGC’s newsletters!
Livable Places Update – April
April’s article: Microtransit: Right-Sizing Transportation to Improve Community Mobility
Currents: Spring 2019
Currents provides readers with current information on energy issues affecting local governments in California.
CivicSpark Newsletter – March
This monthly CivicSpark newsletter features updates on CivicSpark projects and highlights.

