America’s Dangerous Car Culture: Cities Reclaiming Public Places for People
Americans across the nation are driving more – and the results are increased pollution, growing congestion, longer commute times, rising infrastructure costs and a dramatic increase in pedestrian fatalities.
Pedestrian traffic fatalities have increased 51% from 2009 to 2018 in the United States (rising from 4,109 to 6,227 per year). That’s more than 17 people a day – or nearly one person every 90 minutes.
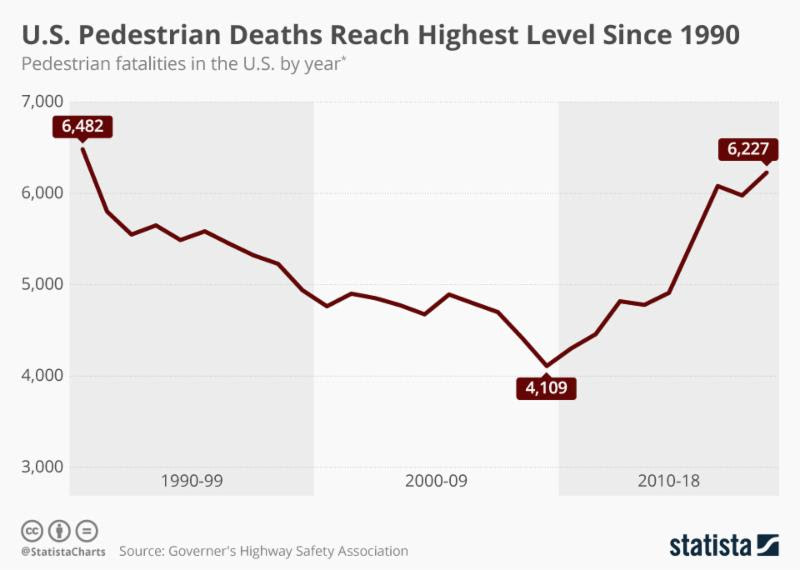
Meanwhile, the number of all other traffic fatalities combined has decreased by 6% over the same time period (from 33,009 to 31,156).
Still, more Americans have died in car crashes since January 2000 than did in both World Wars. The overwhelming majority of the accidents were caused by speeding, drunk motorists or distracted drivers, according to government data.
California has the 10th-highest rate of annual pedestrian fatalities (2.41 per 100,000 residents) among all states in the U.S.
Despite mounting evidence of this growing epidemic, we seem to accept driving and the associated risks as unavoidable. “Where’s the social outrage? There should be social outrage,” said Robert L. Sumwalt, chairman of the National Transportation Safety Board.
Cities Leading the Way
Luckily, many cities are paying attention and proactively taking steps to reduce car trip and address the troubling rise in pedestrian fatalities and other traffic-related fatalities. Communities across the nation – including a dozen in California – have signed on to become “Vision Zero” cities with the goal of reducing the number of fatalities and serious injuries in traffic accidents to zero.
San Francisco: safety improvement and driver training
The City and County of San Francisco was an early adopter of a Vision Zero Action Plan, approving their plan in 2014.
In the four years since, San Francisco has implemented more than 230 miles of safety improvements, initiated more than a dozen public-awareness campaigns, and issued almost 175,000 citations for the most dangerous traffic violations, including running red lights and stop signs, violating pedestrian rights-of-way, and speeding.
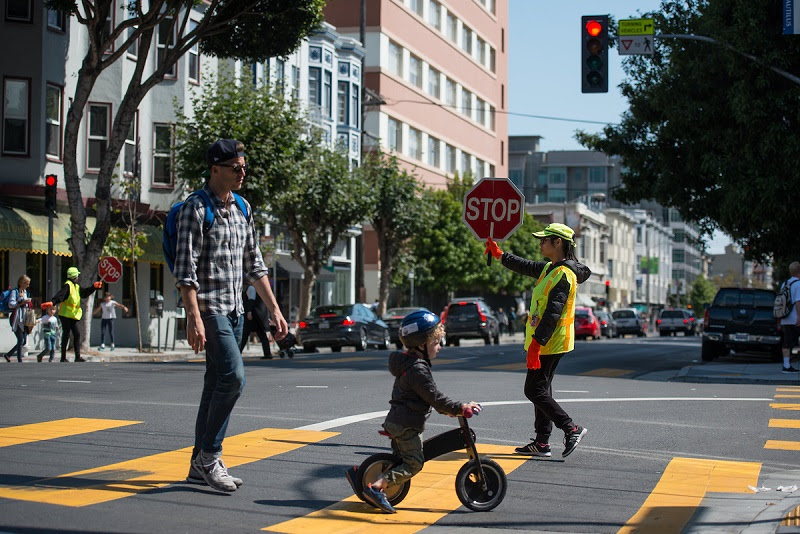
San Francisco’s strategy also places a big emphasis on reducing vehicle miles traveled by prioritizing public transit, bicycling and walking through the San Francisco Municipal Transportation Agency’s Transit First policy.
Acknowledging that large vehicles account for only 4% of collisions but 17% of all fatalities, San Francisco also developed a first-of-its-kind program to train drivers of large vehicles in urban-driving safety.
The city has seen great progress, with all-time lows in traffic deaths reached in both 2017 and 2018.
Portland: safer crossings and slower speeds
Portland’s Vision Zero Action Plan, launched in 2016, has four major strategies: protect pedestrians, reduce speeds, design streets to protect human lives, and create a culture of shared responsibility.
Their work to protect pedestrians includes retrofitting 10 priority crossings a year to give pedestrians more visibility, putting a “no right on red” restriction at priority high-crash intersections, and prioritizing lighting investments in key areas.
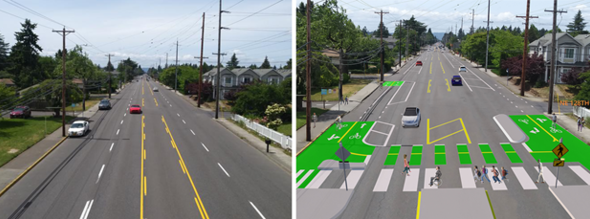
Portland has also consistently and aggressively attempted to reduce speeds on city-owned streets, although this decision can only be granted from the state department of transportation. As a result, the City of Portland is also pursuing authority to set speed limits locally.
To build a culture of shared responsibility, Portland has committed to installing a prominent electronic sign at the site of all deadly crashes to raise public awareness about the importance of driving safely. They are also deploying monthly crosswalk education and enforcement actions with a focus on High Crash Network Streets.
In 2018, traffic deaths in Portland were the lowest in four years, down nearly 25% from the previous year.
Sacramento: targeting high-injury streets for safety measures
In 2018, the City of Sacramento adopted a Vision Zero Action Plan to eliminate traffic fatalities and serious injuries by 2027.
The plan began by identifying a High Injury Network, which includes the corridors with the highest levels of fatal and serious injuries for pedestrians. This process revealed that Sacramento’s high-injury areas comprise only 14% of its roadways, but account for 79% of the city’s fatal crashes.
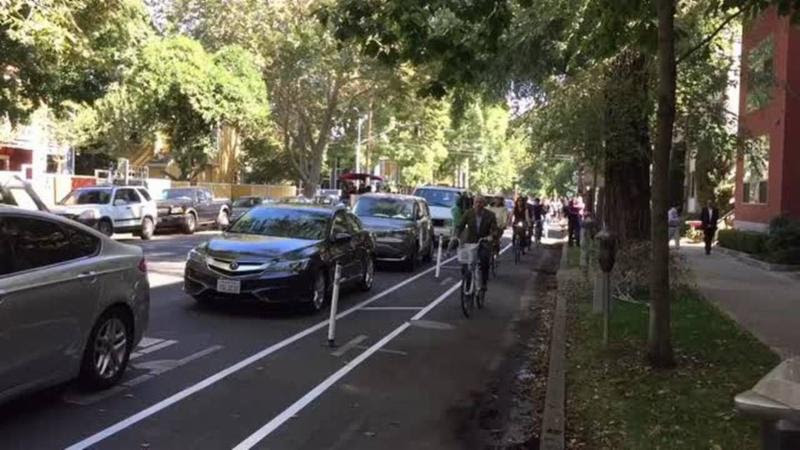
This, along with equity considerations, helped the city frame priority projects to implement and improve safety. To date, the city has added a number of protected bike lanes, installed a segment of cycle track, built a bike and pedestrian bridge, added a number of mid-block crossings with enhanced safety features, and advanced other complete streets projects.
Austin: more sidewalks and pedestrian improvements
Austin’s Pedestrian Action Safety Plan, adopted in 2018, offers 21 key recommendations in engineering, education, enforcement, evaluation, policy, land use, partnerships and funding to create a safer and more walkable environment for pedestrians.
One unique concern in Austin is its large number of missing or deficient sidewalks. Crash data highlighted this problem, showing that a crash occurring in an area where sidewalks are missing on both sides of the street is nearly twice as likely to result in a serious injury or fatality compared to a crash in a location with a sidewalk on at least one side of the street.
As a result, the City also adopted a Sidewalk Master Plan that takes into account dozens of factors related to safety, demand and equity considerations, and will address all high-priority sidewalks within 10 years.
Along with these actions, Austin is following other Vision Zero best practices, including installing high-impact, cost-effective pedestrian-safety improvements, speed management, educational materials and targeted educational campaigns.
Seattle: reducing distracted driving
Seattle’s approach to Vision Zero includes the same major themes as the other cities we’ve mentioned: pedestrian safety projects, educational resources and more strict enforcement of the rules of the road.
Along with this approach, the City also implemented an experimental program to curtail smartphone usage and encourage safe driving. An increase in smartphone usage over the past decade is a growing trend and a major safety concern. Seattle turned these tools into safety-enhancing devices, and launched a two-month app-based competition to determine who is the safest driver in Seattle.
Users had to download an app that tracked all their trips, and measured their speed, acceleration, braking, cornering and level of phone distraction. The safer you are, the higher you score.
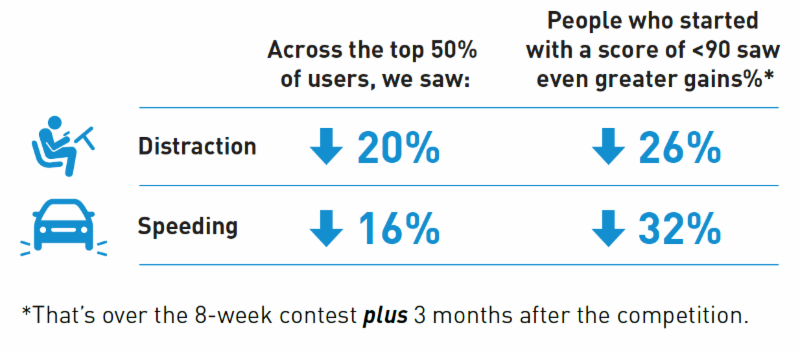
After the two-month contest (with a cash prize to the winner), they noticed an improvement in driving safety across most of their users. Among the top half of users, a 20% decrease in distraction and a 16% decrease in speeding throughout the two-month trial was recorded. These numbers were even higher for the top drivers.
A similar contest also had successful results in Boston.
Planning for people: investing in better mobility options
Beyond these kinds of infrastructure improvements and behavioral changes, autonomous vehicles have the potential to address some of the traffic safety concerns. The National Highway Traffic Safety Administration estimates that 94% of car crashes are caused by human error – reducing the risk of tired, distracted or drunk drivers through automated vehicles could increase safety overall.
Vehicle conversion, however, will take place over a period of decades and its effect upon congestion, pollution and infrastructure costs could vary depending on how successful we are at accelerating and achieving a shared, electric mobility future (versus individually owned cars and increased convenience of driving).
Electrification of cars, traditional and automated alike will help address some of the pollution and climate-change concerns associated with America’s car culture, although it won’t necessarily alleviate congestion, infrastructure costs or safety concerns.
Therefore, communities should ultimately be aiming to achieve a “loading order,” prioritizing land-use decisions and infrastructure investments that support bicycling, walking and rolling first (such as scooters and wheelchairs), transit and shared mobility second, and electric/clean-fuel vehicles in cases where other options aren’t available (particularly in suburban and rural areas).
Designing streets – and communities – for people, not cars
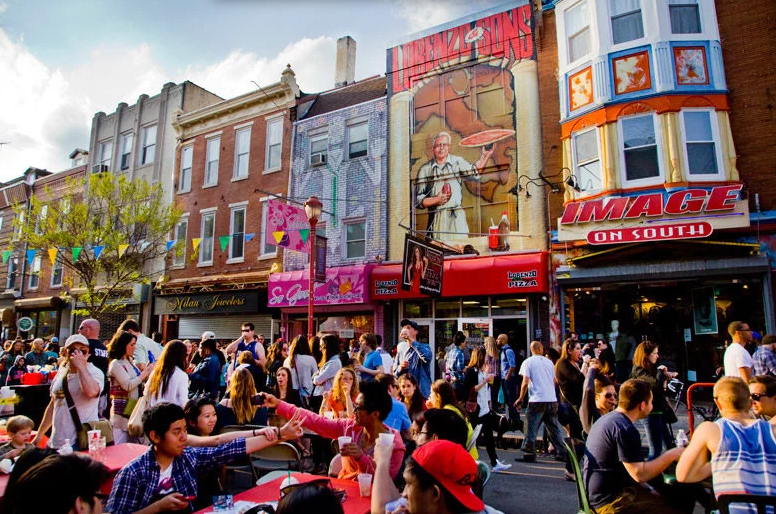
Local leaders are increasingly acknowledging the damaging impacts of our car-oriented communities and shifting to plan around people – their health, safety and quality of life. Communities whose housing, jobs and daily needs are located within easy walking distance of each other- and within an accessible network of convenient transit stops, pedestrian and bike paths, and safe streets- provide opportunities to reduce car use while also addressing associated health, economic and environmental impacts.
They are also exactly the type of communities people prefer to live in, according to the National Association of Realtors. In fact, six in 10 residents would pay more to live in a walkable community, while one in five currently living in a detached home would prefer to live in an attached home in a walkable neighborhood with a shorter commute. Overall, people with places to walk are more satisfied with the quality of life in their community.
By designing and retrofitting neighborhoods for people first we can improve public health and safety and address a myriad of critical community priorities.
Resources
Vision Zero SF Action Strategy
Vision Zero SF How Are We Doing?
Portland’s Vision Zero Commitment
Saving Lives with Safe Streets Portland
Austin Pedestrian Action Plan
Austin Sidewalk Master Plan
Vision Zero Sacramento
Seattle Safest Driver Program
Local Government Commission Newsletters
Livable Places Update
CURRENTS Newsletter
CivicSpark™ Newsletter
LGC Newsletters
Keep up to date with LGC’s newsletters!
Livable Places Update – April
April’s article: Microtransit: Right-Sizing Transportation to Improve Community Mobility
Currents: Spring 2019
Currents provides readers with current information on energy issues affecting local governments in California.
CivicSpark Newsletter – March
This monthly CivicSpark newsletter features updates on CivicSpark projects and highlights.


